On the path towards understanding a functioning catalytic process, spectroscopic methods can provide invaluable information about the catalyst, it’s interaction with substrates, and potentially the mechanism of C-H activation. The structure of all new materials must be characterised thoroughly. In addition to confirming the identity of the materials, the obtained data allows one to draw comparisons between different types of materials.
What do catalytically active enzymes/zeolites/MOFs/molecular complexes have in common? In other words- can we identify features that are crucial for a C-H activating copper catalyst?
In order to answer questions of interests in catalysis research a broad range of spectroscopic methods are applied and, in some cases, open questions drive new method developments. All spectroscopic methods are based on the interaction of matter with electromagnetic radiation, which varies from low-energetic microwaves employed in NMR (see Magnetic Resonance section) to the highly energetic X-rays (See the X-ray spectroscopy section). In the sections below, short descriptions of the methods we apply to investigate the copper-based systems in the CuBE project are provided. Copper ions enable the challenging transformations targeted in CuBE project. They are usually found as divalent cations – Cu(II) – with 9 electrons in the 3d shell and one unpaired electron, yielding often paramagnetic samples. They can store one reducing equivalent by forming diamagnetic Cu(I), with d10 configuration, which later can be released in reactions such as with O2 and H2O2 to form oxygen-containing reactive intermediates able to activate C-H bonds. Once coordinated to strong electronic donor ligands, they can in some cases be oxidized to Cu(III) d8 species. Cu(III) species have been characterized in both coordination and organometallic compounds, but so far have never been observed in enzymes. The unusually high oxidation state makes some Cu(III) compounds strong oxidants which are able to abstract hydrogens from hydrocarbons. While the suitability of some methods depends on the para- or diamagnetism of the samples, others are sensitive to all forms of the target element.
EPR
In Electron Paramagnetic Resonance (EPR) or Electron Spin Resonance (ESR), the focus is to selectively study systems with unpaired electron(s), such as Cu(II) species. The technique is around a thousand times more sensitive than NMR, allowing one to work with dilute samples and requiring only small amounts of sample. EPR analysis of copper coordination compounds allow one to investigate, among other properties, the oxidation state, the geometry around copper and the covalency of the bonds with the ligands.
In Electron Paramagnetic Resonance (EPR) or Electron Spin Resonance (ESR), the focus is to selectively study systems with unpaired electron(s), such as Cu(II) species. The technique is around a thousand times more sensitive than NMR, allowing one to work with dilute samples and requiring only small amounts of sample. EPR analysis of copper coordination compounds allow one to investigate, among other properties, the oxidation state, the geometry around copper and the covalency of the bonds with the ligands.
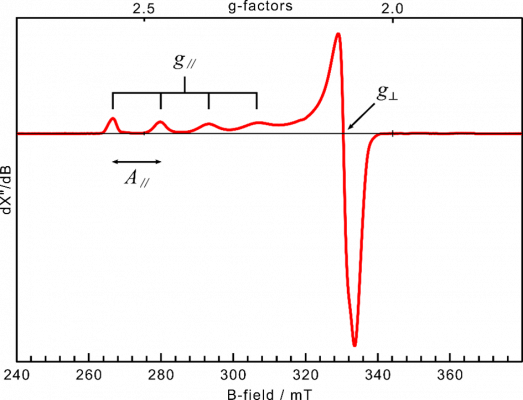
Slow tumbling molecules in solution, frozen solutions and solid materials show an anisotropy of the resonance. If the material is a statistical mix of all possible orientations (not a single crystal), multiple g factors are measured, e.g. in the EPR spectrum in Figure 1 the two factors g and g
can be determined. The coupling between the unpaired electron spin moment with the copper nucleus’ spin of I = 3/2 results in splitting of the resonance into four signals of equal distance to each other, creating the hyperfine structure. As the hyperfine structure is also anisotropic, the splitting is usually only resolved in A
in Figure 1. By simulating the curve, this allows one to obtain information about the electronic and geometrical structure in the surrounding of the electron.Slow tumbling molecules in solution, frozen solutions and solid materials show an anisotropy of the resonance. If the material is a statistical mix of all possible orientations (not a single crystal), multiple g factors are measured, e.g. in the EPR spectrum in Figure 1 the two factors g
and g
can be determined. The coupling between the unpaired electron spin moment with the copper nucleus’ spin of I = 3/2 results in splitting of the resonance into four signals of equal distance to each other, creating the hyperfine structure. As the hyperfine structure is also anisotropic, the splitting is usually only resolved in A
in Figure 1. By simulating the curve, this allows one to obtain information about the electronic and geometrical structure in the surrounding of the electron.
NMR
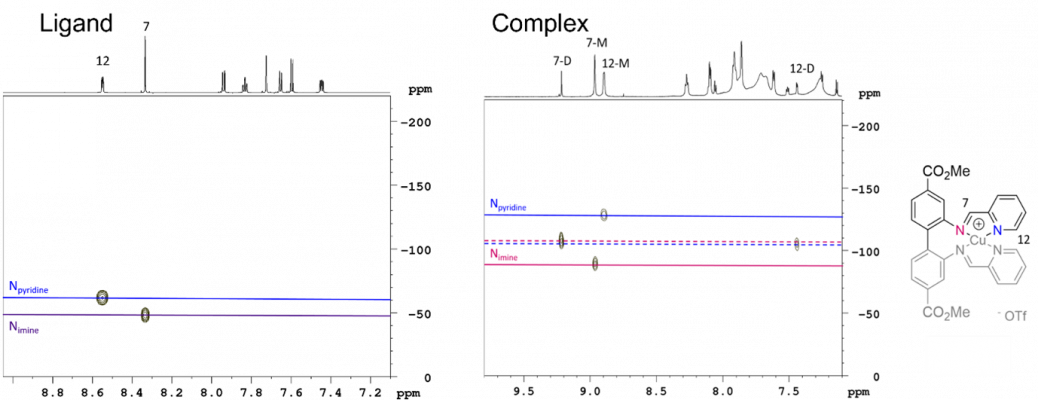
Diamagnetic species such as Cu(I) and low spin Cu(III) are EPR-silent, but readily detectable by Nuclear Magnetic Resonance (NMR), while EPR-active Cu(II), often don’t give interpretable NMR, thus making EPR and NMR complementary techniques to study copper-containing compounds, materials and enzymes. Both stable isotopes of copper (63Cu and 65Cu) are NMR-active nuclei, however Cu NMR is limited to solids and highly symmetric species due to the broadness of the resonances. Therefore, the NMR studies of molecular Cu(I) complexes usually target NMR active nuclei in the ligand (e.g. 1H, 13C and 15N) or the counter ion. Beyond the techniques used for structural elucidation of the ligand, a variety of NMR experiments allows the properties of the metal complex to be investigated. For example, the difference in chemical shift of the nitrogen resonances of the ligand before and after coordination (so-called coordination shifts), allows the relative coordination strengths of different nitrogen moieties to be compared. The nitrogen shifts are determined indirectly due to the low natural abundance and sensitivity of 15N (Figure 2).
X-Ray Absorption Spectroscopy
Cu K-edge XAS
X-ray Absorption Spectroscopy (XAS) is an element selective method and as such it probes the target element in all oxidation and spin states. In Cu K-edge XAS, an electron in a 1s orbital of Cu atom is excited to the valence levels – generating absorption peaks in the edge region informative of the electronic structure – and eventually to the continuum – generating oscillatory patterns in the EXAFS region informative of the geometry around the absorber atom. The extraordinary element-selectivity, as well as the sensitivity to oxidation state, spin state and coordination geometry of the probed element led to a widespread use of this technique in coordination chemistry, (bio)inorganic chemistry, and catalysis research (including both in situ and operando applications). Moreover, what was once a largely synchrotron-based technique is also being applied more and more on a lab scale with new technologies within our reach.[2][3][4][5]
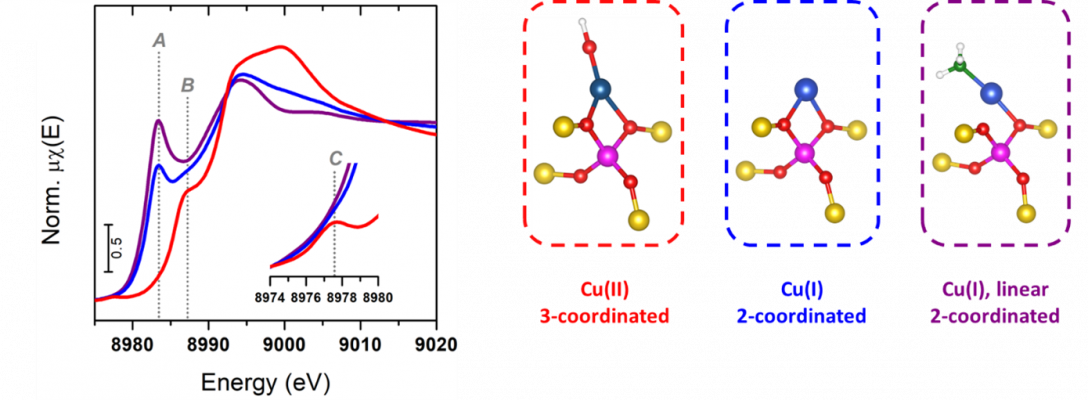
The peaks in the Cu(II) pre-edge region are 1s to 3d dipole forbitten transitions, as s to d orbitals don’t follow Δl = ±1 selection rule. However, the high incident photon energy makes the electric quadrupole term of the operator expansion relevant to impart intensity, albeit low in typical square planar Cu(II). On the other hand, Cu(I) being d10 lacks a pre-edge, but shows highly informative dipole-allowed rising edge features appearing at lower energies relative to Cu(II) due to the lower effective nuclear charge. These 1s to 4p peaks in Cu(I) are classically rationalized in terms of the splitting of 4p orbitals depending on the coordination symmetry (e.g. linear, tetrahedral, trigonal)[6]. In Cu(III) XAS, the higher effective nuclear charge binds the 1s electrons more tightly, causing the position of the K-edge to shift to higher energies relative to Cu(II). The attributions of the pre-edge absorption peaks are consistent with a d8 configuration, in which the 3d shell strongly mixes with ligand orbitals as a consequence of the covalency caused by the large electronic donation ability required to stabilize the metal’s unusual high oxidation state.
Once the incident energy is enough to promote the core electron to the continuum level of states, it is ejected as a photoelectron subjected to scattering from the nuclei around the absorber atom. The interference of the outgoing electron wave with the incoming backscattering waves results in modulations of the post-edge spectrum, known as Extended X-ray Absorption Fine Structure (EXAFS). The careful simulation and spectral fitting based on the superposition of scattering waves with allow one to extract from this part of the XAS spectrum information about the number and type of surrounding atoms, as well as their distance from the emitter. EXAFS both in transmission mode and in high energy resolution fluorescence-detected (HERFD) mode is a powerful technique to selectively investigate the copper coordination environment in a material or enzyme[8][9].
Cu VtC-XES
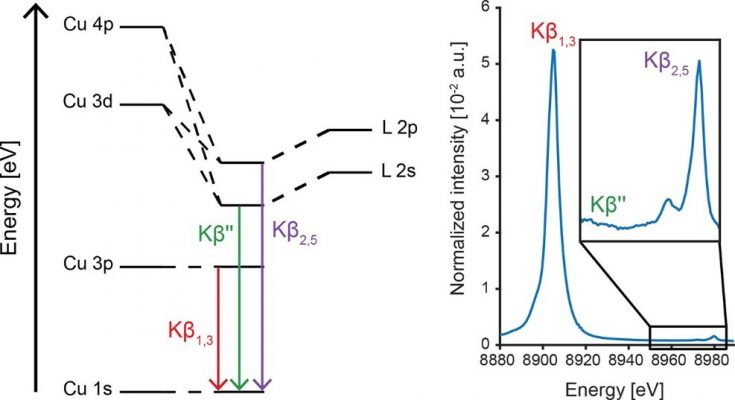
X-ray emission spectroscopy (XES). When a 1s core electron is ionized by an incident X-ray beam with an energy above the absorption edge, a series of electronic transitions in the absorber atom is triggered to fill the core hole with concomitant release of energy in the form of X-rays. This results in a series of emission lines. In the case of first-row transition metals, such as copper for example, the 2p → 1s decay leads to the very intense Kα lines; 3p → 1s decay give rise to the Kβ main lines. Electronic decay from valence orbitals above 3p up to the HOMO are also able to produce emission lines, although with a much smaller probability. These weak emissions are the valence-to-core (VtC) lines. While the splitting between the VtC lines (Kβ’’ and Kβ2,5) is dictated by the splitting of the 2s and 2p ligand orbitals, the intensity is dictated by the Cu np admixture in the valence molecular orbitals (assuming N, O ligands in a Cu VtC XES experiment, for example). For this reason, unlike EXAFS, VtC XES is sensitive to the nature of light ligand element (e.g. N vs O), as it impacts the 2s/2p ionization potentials; sensitive to the protonation state (e.g. OH– vs H2O) as H+ affects 2s/2p levels; coordination site symmetry and metal-ligand distance, as the combination between Cu p-orbitals with valence molecular orbitals is dependent on the symmetry criteria and on their overlap. VtC XES is therefore able to assess the degree of activation of small molecules coordinated to Cu center(s)[10].
Such sensitivity has allowed VtC XES to become a valuable tool for (bio)inorganic chemistry and catalysis studies, from which one is able to extract a wealth of information about the geometry and electronic structure of resting states and reactive intermediates on an element-specific manner[11][12][13].
Theory-Assisted Interpretation
The information content of many spectroscopic methods can be enhanced through correlations with computations. Density functional theory (DFT) is a popular method, able to provide valuable insights in the interpretation of experimental findings. Quantum chemical software such as ORCA[15] enables the efficient use of DFT as well as many other methods to calculate molecular and spectroscopic properties with reliable correlation with experimental information, such as structures and spectroscopic observables[16].
NMR chemical shifts can be readily calculated utilizing the Gauge Including Atomic Orbitals (GIAO) at various level of theory and in the presence of implicit solvation models. The absolute shielding values (in ppm) are obtained, from which the absolute shielding of a reference compound (e.g. TMS) calculated at the same level of theory need to be subtracted to result in chemical shifts directly comparable with the experimental values. Shielding tensors can be visualized and spin-spin coupling constants calculated in order to generate completely simulated NMR spectra. This method can be relevant to aid the interpretation of diamagnetic Cu(I) samples amene to NMR experiment.
For EPR-active Cu(II) species, for example, one can resort to g-tensor calculations also based on the GIAO machinery. A special radial integration grid, large basis set must be assigned to the copper centre and spin-orbit coupling need to be included for state-of-the-art calculations applied to PlAA10 LPMO benchmarked against an extensive set of Cu(II) complexes[17].The hyperfine coupling constants can also be obtained in ORCA following methodologies optimized for Cu(II)[18].
Calculated K-edge X-ray absorption spectra are obtained by Time dependent DFT (TDDFT) aids the interpretation of electronic and structural effects affecting the Cu core in the various systems under study. The calculated K-edge XAS spectra either for the metal[19][20] or for the ligand[21] K-edge can particularly help in the validation of structural models and rationalization of the chemical environment on the Cu site. The calculation of valence-to-core (VtC) X-ray emission spectra based on a one-electron approximation[22] is also readily available and very often furnishes the spectroscopist with a model in close agreement with the experimental data.
Finally, constructing high-level hybrid quantum-mechanical/molecular mechanical (QM/MM) models enable us to take into consideration the complete protein/enzyme to gain in-depth insights on conformational effects on reaction mechanism.
For more information check these articles:
[1] I. Gerz, S. A. V. Jannuzzi, K. T. Hylland, C. Negri, D. S. Wragg, S. Øien-Ødegaard, M. Tilset, U. Olsbye, S. DeBeer, M. Amedjkouh, Eur. J. Inorg. Chem.2021, 4762–4775.
[2] P. Zimmermann, S. Peredkov, P. M. Abdala, S. DeBeer, M. Tromp, C. Müller, J. A. van Bokhoven, Coord. Chem. Rev. 2020, 423, 213466.
[3] W. Malzer et al., Elsevier Spectrochimica Acta Part B: Atomic Spectroscopy Volume 177, March 2021, 106101
[4] Honkanen, A.-P.; Ollikkala, S.; Ahopelto, T.; Kallio, A.-J.; Blomberg, M.; Huotari, S. Johann-type laboratory-scale x-ray absorption spectrometer with versatile detection modes. Rev. Sci. Instrum. 2019, 90 (3), 033107
[5] Seidler, G. T.; Mortensen, D. R.; Remesnik, A. J.; Pacold, J. I.; Ball, N. A.; Barry, N.; Styczinski, M.; Hoidn, O. R. A laboratory-based hard x-ray monochromator for high-resolution x-ray emission spectroscopy and x-ray absorption near edge structure measurements. Rev. Sci. Instrum. 2014, 85 (11), 113906
[6] Kau et al. J . A m . Chem. Soc. 1987, 109, 6433-6442
[7] Geoghegan, B. L., Liu, Y., Peredkov, S., Dechert, S., Meyer, F., Debeer, S., & Cutsail, G. E.. Combining Valence-to-Core X-ray Emission and Cu K-edge X-ray Absorption Spectroscopies to Experimentally Assess Oxidation State in Organometallic Cu(I)/(II)/(III) Complexes. Journal of the American Chemical Society, 2022, 144(6), 2520–2534.
[8] S. Calvin, XAFS for Everyone, CRC Press, 2013.
[9] Serena Debeer, Methods in Enzymology Volume 599, 2018, Pages 427-450.
[10] Cutsail, G. E., Gagnon, N. L., Spaeth, A. D., Tolman, W. B., & DeBeer, S.. Valence‐to‐Core X‐ray Emission Spectroscopy as a Probe of O−O Bond Activation in Cu 2 O 2 Complexes. Angewandte Chemie International Edition, 2019, 58(27), 9114–9119.
[11] Kowalska, J. K., Lima, F. A., Pollock, C. J., Rees, J. A., & DeBeer, S.. A Practical Guide to High-resolution X-ray Spectroscopic Measurements and their Applications in Bioinorganic Chemistry. Israel Journal of Chemistry, 2016, 56(9–10), 803–815.
[12] Gallo, E., & Glatzel, P. Valence to Core X-ray Emission Spectroscopy. Advanced Materials, 2014, 26(46), 7730–7746.
[13] Cutsail III, G. E., & DeBeer, S.. Challenges and Opportunities for Applications of Advanced X-ray Spectroscopy in Catalysis Research. ACS Catalysis, 2022, 5864–5886.
[14] T. D. W. Claridge, High-Resolution NMR Techniques in Organic Chemistry, Elsevier, Boston, 2016.
[15] Neese, F. Software update: The ORCA program system—Version 5.0. WIREs Computational Molecular Science, (2022), 1–15.
[16] Neese F. Prediction of molecular properties and molecular spectroscopy with density functional theory: From fundamental theory to exchange-coupling. Coordination Chemistry Reviews. 2009 Mar 1;253(5-6):526-63.
[17] Gómez-Piñeiro RJ, Drosou M, Bertaina S, Decroos C, Simaan AJ, Pantazis DA, Orio M. Decoding the ambiguous electron paramagnetic resonance signals in the lytic polysaccharide monooxygenase from photorhabdus luminescens. Inorganic Chemistry. 2022 May 12;61(20):8022-35.
[18] Gómez‐Piñeiro RJ, Pantazis DA, Orio M. Comparison of density functional and correlated wave function methods for the prediction of Cu (II) hyperfine coupling constants. ChemPhysChem. 2020 Dec 14;21(24):2667-79.
[19] DeBeer George, S., Petrenko, T., & Neese, F.. Prediction of Iron K-Edge Absorption Spectra Using Time-Dependent Density Functional Theory. The Journal of Physical Chemistry A, 112(50), 2008, 12936–12943.
[20] Chandrasekaran, P., Stieber, S. C. E., Collins, T. J., Que, Jr., L., Neese, F., & DeBeer, S.. Prediction of high-valent iron K-edge absorption spectra by time-dependent Density Functional Theory. Dalton Transactions, 2011, 40(42), 11070.
[21] DeBeer George, S., & Neese, F.. Calibration of Scalar Relativistic Density Functional Theory for the Calculation of Sulfur K-Edge X-ray Absorption Spectra. Inorganic Chemistry, 2010, 49(4), 1849–1853.
[22] Lee, N., Petrenko, T., Bergmann, U., Neese, F., & DeBeer, S.. Probing Valence Orbital Composition with Iron Kβ X-ray Emission Spectroscopy. Journal of the American Chemical Society, 2010, 132(28), 9715–9727.